Fixing Magento 2 Core MySQL performance issues using Percona Monitoring and Management (PMM)
The Magento 2 Fortune 500 merchant noticed a high CPU usage in their AWS MySQL instances and could not figure out why as there was no much traffic hitting the store. We needed to reduce the high CPU usage on AWS MySQL RDS. Lucky to us, this merchant doesn’t use Magento Commerce Cloud, which is the worst platform for monitoring and optimization. We were able to install PMM and troubleshoot the issue.
Let’s see how PMM can be used to troubleshoot the issue.
CPU Magento MySQL issue

It’s important to understand where the CPU time is being consumed: userspace, system space, iowait, and so on. Here we can see that CPU usage was hitting almost 100%, and the majority of the time was being spent on userspace. In other words, the time the CPU was executing user code. Once we determined that the time was being spent on userspace, we could discard other possible issues. For example, we could eliminate the possibility that many threads were competing for CPU resources since that would cause an increase in context switches, which in turn would be taken care of by the kernel — system space.
Look into MySQL metrics:
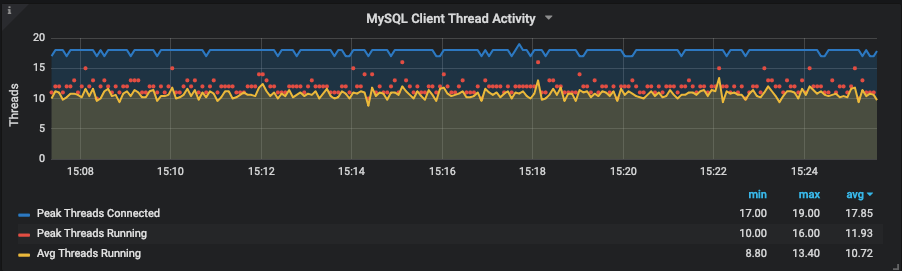
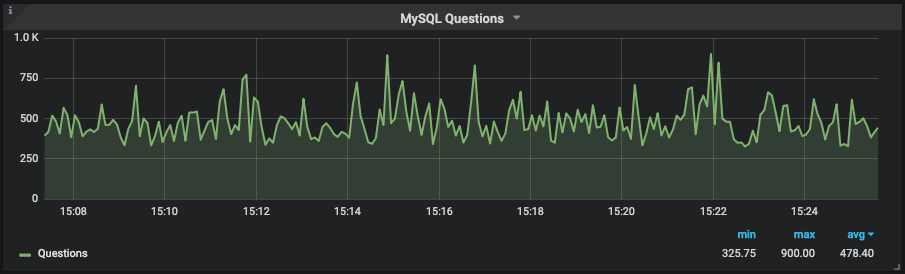
As expected, there weren’t a lot of threads running — 10 on average. It was running from 500 to 800 QPS (queries per second). The next step was to check the type of workload that was running on the instance:

In red, we can see that almost all commands are SELECTS. With that in mind, we checked the handlers using SHOW STATUS LIKE ‘Handler%’ to verify if those selects were doing an index scan, a full table scan, or what.

Blue in this graph represents Handler_read_rnd_next , which is the counter MySQL increments every time it reads a row when it’s doing a full table scan. Bingo!!! Around 350 selects were reading 2.5 million rows. But wait — why was this causing CPU issues rather than IO issues? If you refer to the first graph (CPU graph), we cannot see iowait.
That is because the tables stores the data in the InnoDB Buffer Pool (RAM Memory), so instead of having to read those 2.5M rows per second from the disk, it was fetching them from memory. The stress had moved from disk to CPU. Now that we identified that some queries or queries had caused the issue, we went to QAN to verify the queries and check their status.
The first query, a SELECT on table catalog_product_entity_varchar, was responsible for 98% of the load and executed 20+ seconds.
Update: The same issue I have found with the Adobe commerce (Magento Enterprise) target ruless functionality. It has the next slow query:
More in this post:
SELECT `e`.`entity_id` FROM `catalog_product_entity` AS `e` INNER JOIN `catalog_product_index_price` AS `price_index` ON price_index.entity_id = e.entity_id AND price_index.website_id = ? AND price_index.customer_group_id = ? INNER JOIN `catalog_category_product_index_store?` AS `cat_index` ON cat_index.product_id=e.entity_id AND cat_index.store_id=? AND cat_index.visibility IN(?, ?) AND cat_index.category_id=? INNER JOIN `cataloginventory_stock_item` AS `at_inventory_in_stock` ON (at_inventory_in_stock.`product_id`=e.entity_id) AND ((at_inventory_in_stock.use_config_manage_stock = ? AND at_inventory_in_stock.manage_stock=? AND at_inventory_in_stock.is_in_stock=?) OR (at_inventory_in_stock.use_config_manage_stock = ? AND at_inventory_in_stock.manage_stock=?) OR (at_inventory_in_stock.use_config_manage_stock = ? AND at_inventory_in_stock.is_in_stock=?)) WHERE ((( e.row_id IN (SELECT `t`.* FROM (SELECT IFNULL(relation.parent_id, table.row_id) FROM `catalog_product_entity_varchar` AS `table` INNER JOIN `catalog_product_relation` AS `relation` ON table.row_id=relation.child_id WHERE (table.attribute_id=?) AND (table.store_id=?) AND (`table`.`value`=:targetrule_bind_?) UNION SELECT `table`.`row_id` FROM `catalog_product_entity_varchar` AS `table` WHERE (table.attribute_id=?) AND (table.store_id=?) AND (`table`.`value`=:targetrule_bind_?)) AS `t`) AND (`e`.`attribute_set_id`=?) AND e.row_id IN (SELECT `t`.* FROM (SELECT IFNULL(relation.parent_id, table.row_id) FROM `catalog_product_entity_int` AS `table` INNER JOIN `catalog_product_relation` AS `relation` ON table.row_id=relation.child_id WHERE (table.attribute_id=?) AND (table.store_id=?) AND (`table`.`value`=:targetrule_bind_?) UNION SELECT `table`.`row_id` FROM `catalog_product_entity_int` AS `table` WHERE (table.attribute_id=?) AND (table.store_id=?) AND (`table`.`value`=:targetrule_bind_?)) AS `t`) AND (SELECT COUNT(*) FROM `catalog_category_product` WHERE (product_id=e.entity_id) AND (FIND_IN_SET(`category_id`, :targetrule_bind_?))) > ?)) AND (`e`.`entity_id` NOT IN(?))) AND (e.created_in <= ?) AND (e.updated_in > ?) LIMIT ?More you can find in this Post:
EXPLAIN confirmed our suspicions. The query was accessing the table using type ALL, which is the last type we want as it means “Full Table Scan.” Taking a look into the fingerprint of the query, we identified that it was a simple query:


The query was filtering attributes based on the value field select * from catalog_product_entity_varchar where value = ?; As shown in the indexes, that column was not indexed. This query was introduced as part of a new Magento code release of the Irridium Adobe partner.
So, we can consider this is critical Magento 2 core EAV issue. Luck of the index on the value column!
From that point, we were confident that we had identified the problem. There could be more, but this particular query was definitely hurting the performance of the server. When the index has been added, check if CPU usage had dropped, and also check Handler_read_rnd_next.
Results


As we can see above, CPU usage dropped to less than 25%, which is 1/4 of the previous usage level. Handler_read_rnd_next dropped, and we can’t even see it once pt-osc has finished. We had a small increase on Handler_read_next as expected because now MySQL uses the index to resolve the WHERE clause. One interesting outcome is that the instance increased its QPS by 5x after the MYSQL B-tree index was added as CPU/Full Table Scan was no longer limiting performance. On average, query time has dropped from the 20s to only 66ms.
AWS RDS metrics before and after Magento 2 core issues fix:

If you need to fix your Magento 2 performance, email me at (yegorshytikov@gmail.com)